Analytics
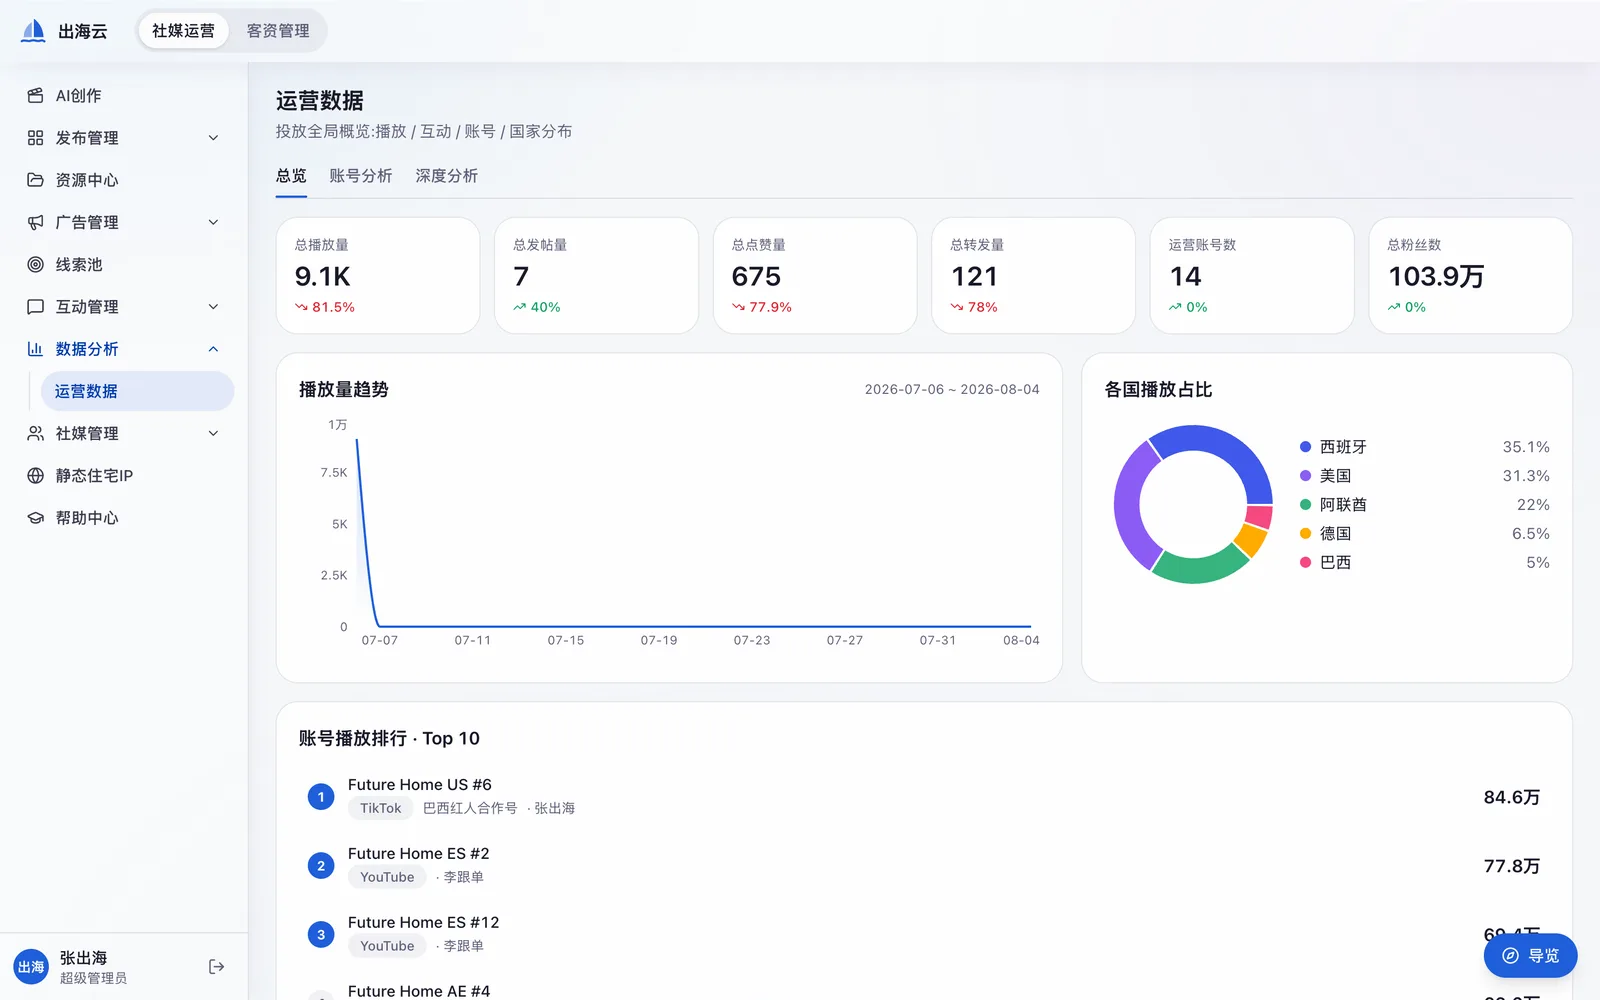
Numbers for the accounts a company owns, in one place. Chuhai Cloud reads back each connected account's own statistics through the platform's official API and shows them together, so a team running fourteen accounts across five markets can see the whole picture without opening five consoles.
What is reported
Totals
Views, posts, likes, reposts, connected accounts and followers, each with the change against the previous period.
Trend
Views over the selected date range, so a campaign or a single video that worked is visible as a shape rather than a number.
By market
Share of views by country, taken from the audience data each platform exposes for the customer's own accounts.
By account
A ranking of the customer's own accounts, with the platform and the teammate responsible for each.
Where the numbers come from
Every figure is read from the platform that owns it, for an account the customer connected. Chuhai Cloud does not estimate, model or scrape metrics, and it does not report on accounts that belong to anyone else. If a platform stops exposing a metric, the metric disappears from the dashboard rather than being filled in with a guess.
Freshness. Platforms do not update engagement data in real time — most interaction metrics settle a day or two after the fact, while follower counts and post metadata are current. Chuhai Cloud shows the figures as the platform reports them and does not present them as live.